

Over the last few weeks I have written articles using data from the last 21 year returns of the S & P 500. Looking at the head start provided by imputation credits (NZ funds) over international funds, PIE funds over international FIF, and alternating between FDR and CV tax methods over FDR only.
Since I have the data collated, I thought I would also look at market timing.
Today, we will be exploring three different types of investors. One who consistently and regularly buys into the share market, one who buys any time the market reaches a new high, and another who only buys when the market experiences an annual decrease.
Again, using the annual returns (before tax and fees, but including dividends) of the S & P 500 from 2004 to 2024.
common types of market timers
We are using these three types of investors as they are the most common around.
1/. The investor who can tune out the noise and invest regularly over the years without panic selling and buying.
2/. The investor who is too nervous about the share market and only invests when they are confident the market is doing well and at all time highs.
3/. The investor who perpetually thinks the market is in bubble territory and doesn’t want to touch it with a barge pole. They wait until the market experiences a drop in value before investing.
Investor one always investing.
Investor two not investing when the market isn’t at all time highs (in this case 2008 to 2013, 2018 to 2019, and 2022 to 2024).
Investor three only investing in shares when there are down years (2008, 2018, and 2022). That is a lot of years not investing for investor three.
For investors two and three who spend periods of time not investing, we will assume they put their annual savings in a bank account at say 4% interest. When investors two and three stop investing we will assume it is only their annual contributions they don’t contribute to the share market. What they already have in the market we will assume they keep there (don’t sell), as they want to hedge their bets.
The results of trying to time the share market
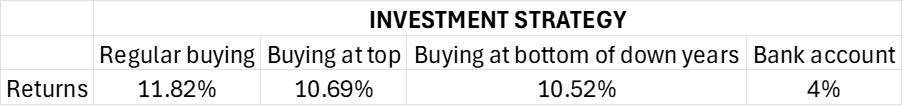
S & P 500 annualised returns 2004 to 2024 for four types of investors
These returns are before tax and fees.
Lessons from trying to time the share market
Don’t be scared of market highs
The worst market timer who bought at the top of the market and no other times, still made returns of around 10% per year. Even though they missed out on those opportunities of buying shares at lower cost in down years. This is because the market experiences a top regularly. You can regularly go 3 years+ of consecutive tops, if not more. This means this investor is regularly in the market.
Don’t wait for market lows
Even the very best market timer in the world who purchased on the best possible years when shares are at annual lows couldn’t perform as well as the regular buyer. The problem with waiting for down years is there are often consecutive years of positive results. So by the time we have a down year, the purchase price may be higher than it was when you weren’t buying years earlier. It also means you miss out on a lot of the best years in the share market. The best years tend to cluster too.
Time in the market is critical
It’s somewhat surprising that buy on the very worst days (top of the market) has better results in this data set than buying at the bottom of a downturn. It intuitively makes sense though. The buy at the top investor is buying into the market much more frequently.
The odds of timing the market enough times over to be worthwhile are minuscule
If you are trying to time the market and be the buy at the bottom or sell at the top investor, your returns will likely be much worse than those shown on the tables because the likelihood of getting the right days multiple times over is near zero.
Looking for safety rarely pays off in the long run
You may think putting your money in the bank whilst the market settles is a good idea, but how can you get your timing so that you are better off than staying in the market? You would have to both sell at the top AND buy at the bottom which is a near statistical impossibility.
The less money you leave in the share market, the worse off you will be over the long run
If the buy at the top investor not only didn’t invest their annual savings, but also withdrew their current savings from the share market, their results would be even worse due to having that much less money in the share market. They would have returns of closer to 10%.
Final thoughts
These examples are the extreme (buying at the exact top or bottom), and may not be typical. Likewise, not many people invest 100% into shares nor 100% in one country like the U.S. You also need to deduct fees and tax from the return figures too. But the key lessons remain the same.
The longer the timeframe and the more you invest into the share market the better. Losses are part of the deal when investing. Trying to get in and out of the market to miss out on or take advantage of the losses and you are likely to experience worse returns than someone who just regularly invests and gets on with life. Not only would the regular investor have better returns, but they would also have much greater peace of mind not having to spend their time panicking about when to sell and when to buy back in. They can focus on more important things, like life!
If you need an investment plan or recommendations, then get in touch today.
The information contained on this site is the opinion of the individual author(s) based on their personal opinions, observation, research, and years of experience. The information offered by this website is general education only and is not meant to be taken as individualised financial advice, legal advice, tax advice, or any other kind of advice. You can read more of my disclaimer here