

For many people, they spend their lives saving and investing to ensure they have enough saved for retirement. But what if I told you that the success of your plan can often come down to the year you retire?
There is an online calculator called fireCalc and it basically tells you how long your money will last based on historical returns. But it differs to many calculators that work on average returns. FireCalc uses real historical returns. Average returns are meaningless. It is the order of returns that matter.
For example, if you experience poor returns early in your retirement, you will be much worse off than someone who experiences poor returns later in retirement. Also known as sequence of returns risk.
Here is an example from the FireCalc website for three people with identical portfolios starting with $750,000, withdrawing $35K per year: One who retired in 1973, another in 1974, and the last in 1975.
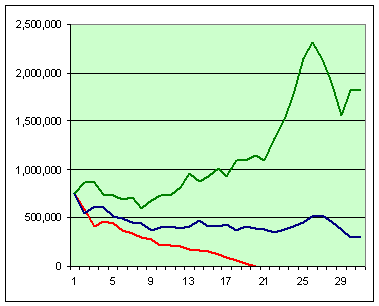
Three contrasting examples of sequence of investment returns
The 1973 retiree runs out of money in 19 years
The 1974 retiree ends up with approximately $400K
The 1975 retiree ends up with approximately $1.8 million.
Same investments and amounts, vastly different results with only one variable. The year they retired.
We will use another example that will show how FireCalc can use hundreds of past time frames. Our assumptions:
2019 retiree
30-year timeframe
$600,000 invested
Portfolio: 60% stocks, 40% fixed income
0.5% investment fees
2.5% inflation
Annual spending of $30,000 adjusted for inflation
NZ Super of $16,000 adjusted for inflation
And we end up with this lovely chart full of colourful lines:

Full range of sequence of returns results
This is the data from 119 different 30-year periods based on the provided assumptions.
The lowest line leaving us with minus $910,500. The highest line with almost $2 million. An average of $310,000.
45 of the 119 periods failed for a success rate of 62%.
Final Thoughts
As you can see, the average means nothing really. It is so far off the lowest and highest points, your planning needs to be much more rigorous than punching in a few numbers.
Your retirement planning should include many margins of safety.
Life does not always happen in a nice straight average line, so it is best to:
Plan for worst case scenarios
Remain flexible and make adjustments to your plan as necessary
Have a portfolio that is not too aggressive, nor too conservative
Your life is too important to leave up to luck.
If you need help with your personal retirement planning, then get in touch today.
The information contained on this site is the opinion of the individual author(s) based on their personal opinions, observation, research, and years of experience. The information offered by this website is general education only and is not meant to be taken as individualised financial advice, legal advice, tax advice, or any other kind of advice. You can read more of my disclaimer here