

February last year I provided a 1 year update for the solar panels we had installed on our home. A $19,000 6.4kw system. After 1 year we had almost recovered 11.5% of the cost of the solar panels.
Now we have an extra years data. How did we fare? Is it still worth it? Are we regretting the decision?
Stay tuned to find an answer to all these questions!
How much solar power did we produce?
Between February 2025 and January 2026 we averaged 746 kWh per month. Again, June the worst month at 360kWh, which equates to just 12 kWh per day.
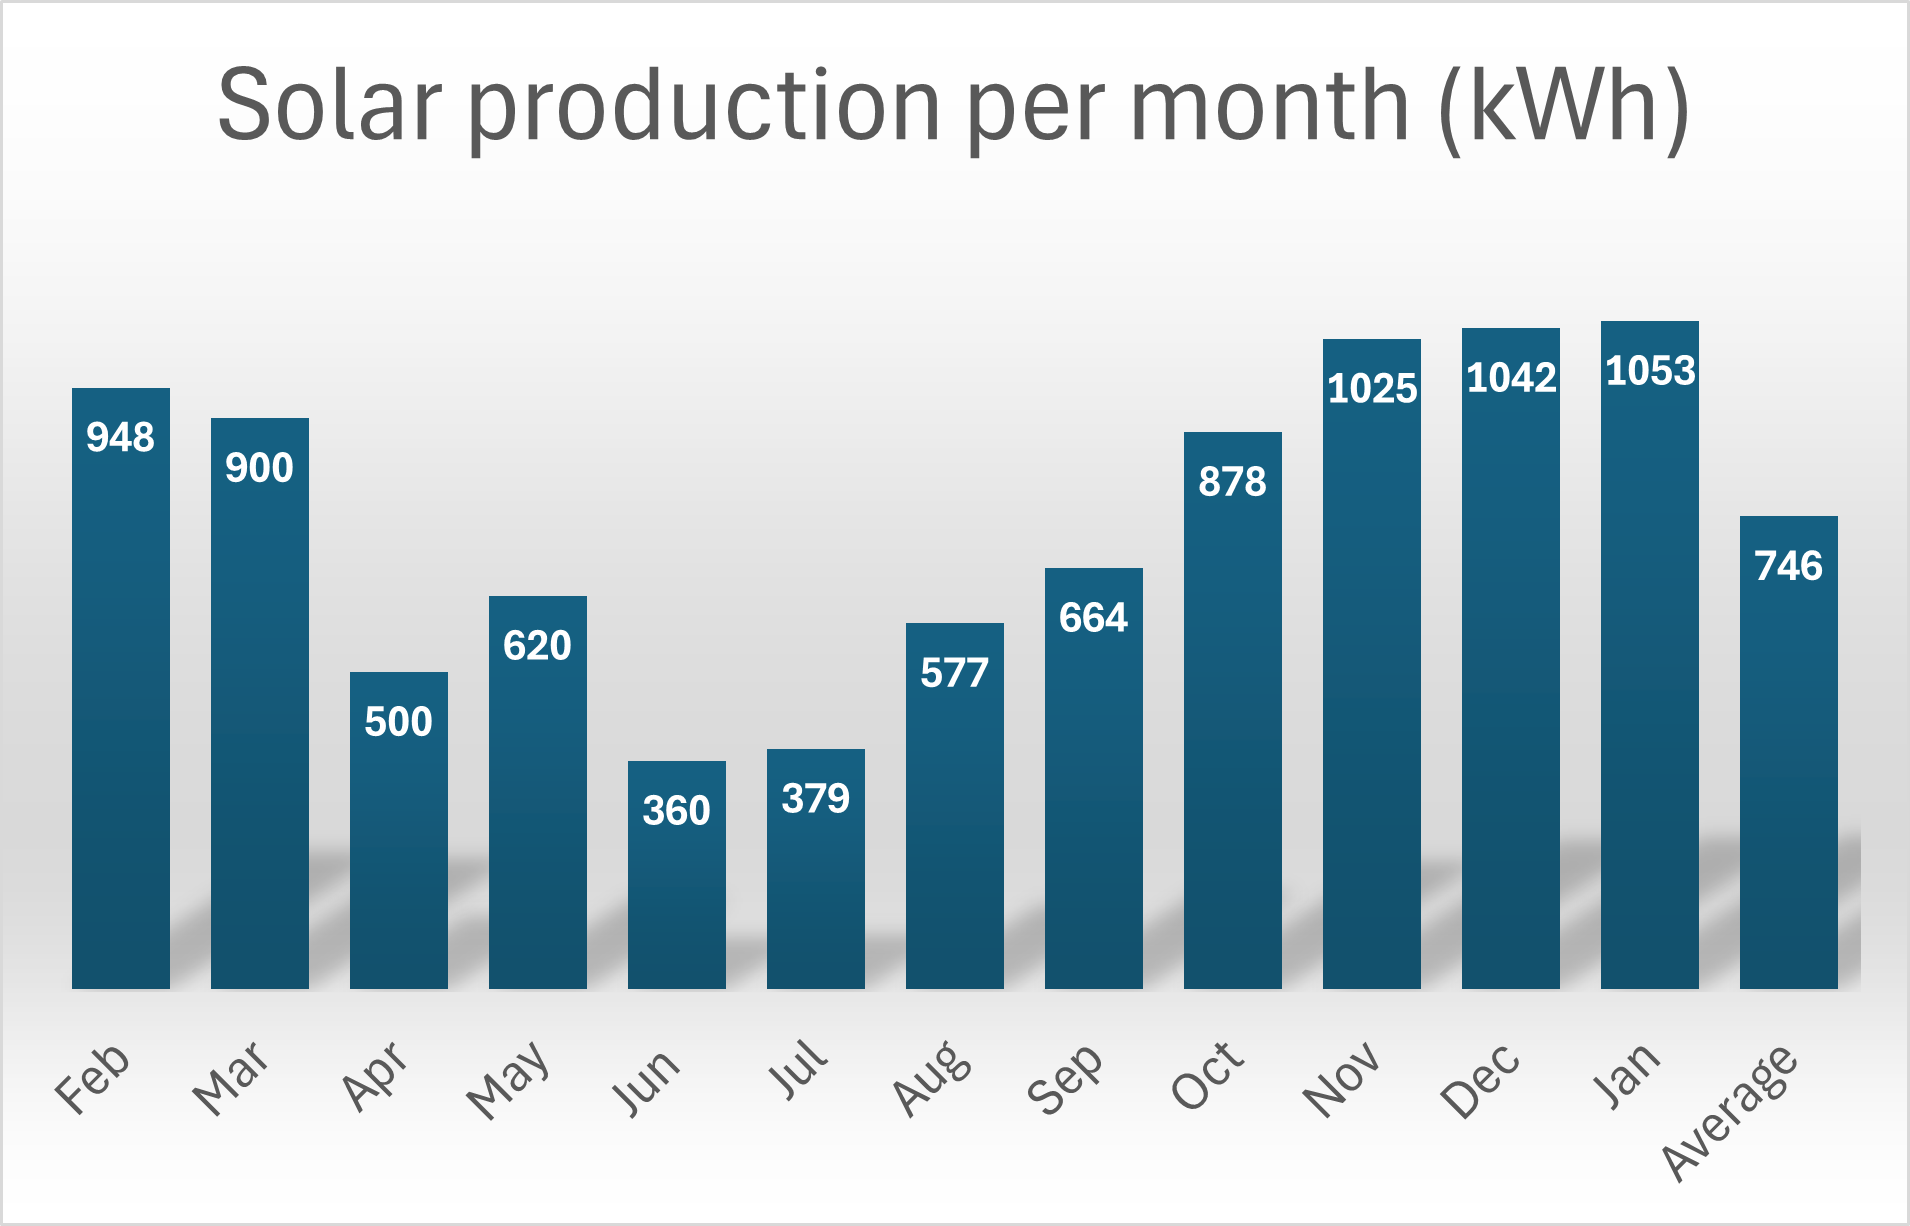
Solar power production per month (February 2025 to January 2026)
This is an annual increase of 224kWh (2.6%).
Of the 746kWh per month, we consumed an average of 392 kWh, which is 53% of total solar production. A big increase in solar consumption. The previous year we consumed just 327kWh per month, and only consumed 45% of total production. That is pleasing as it suggests we are using the power generated more efficiently. Maybe we are getting smarter with our electricity use by delaying certain power hungry tasks until sunny days and so on. The other 47% (354 kWh) we sent back to the grid as we didn’t use or need it. Also pleasing as we sent an average 400kWh per month back to the grid last year. We are using more of the power generated for our own use which is great as it costs more to use power than we would receive from selling power to the grid.
How much power did we consume?
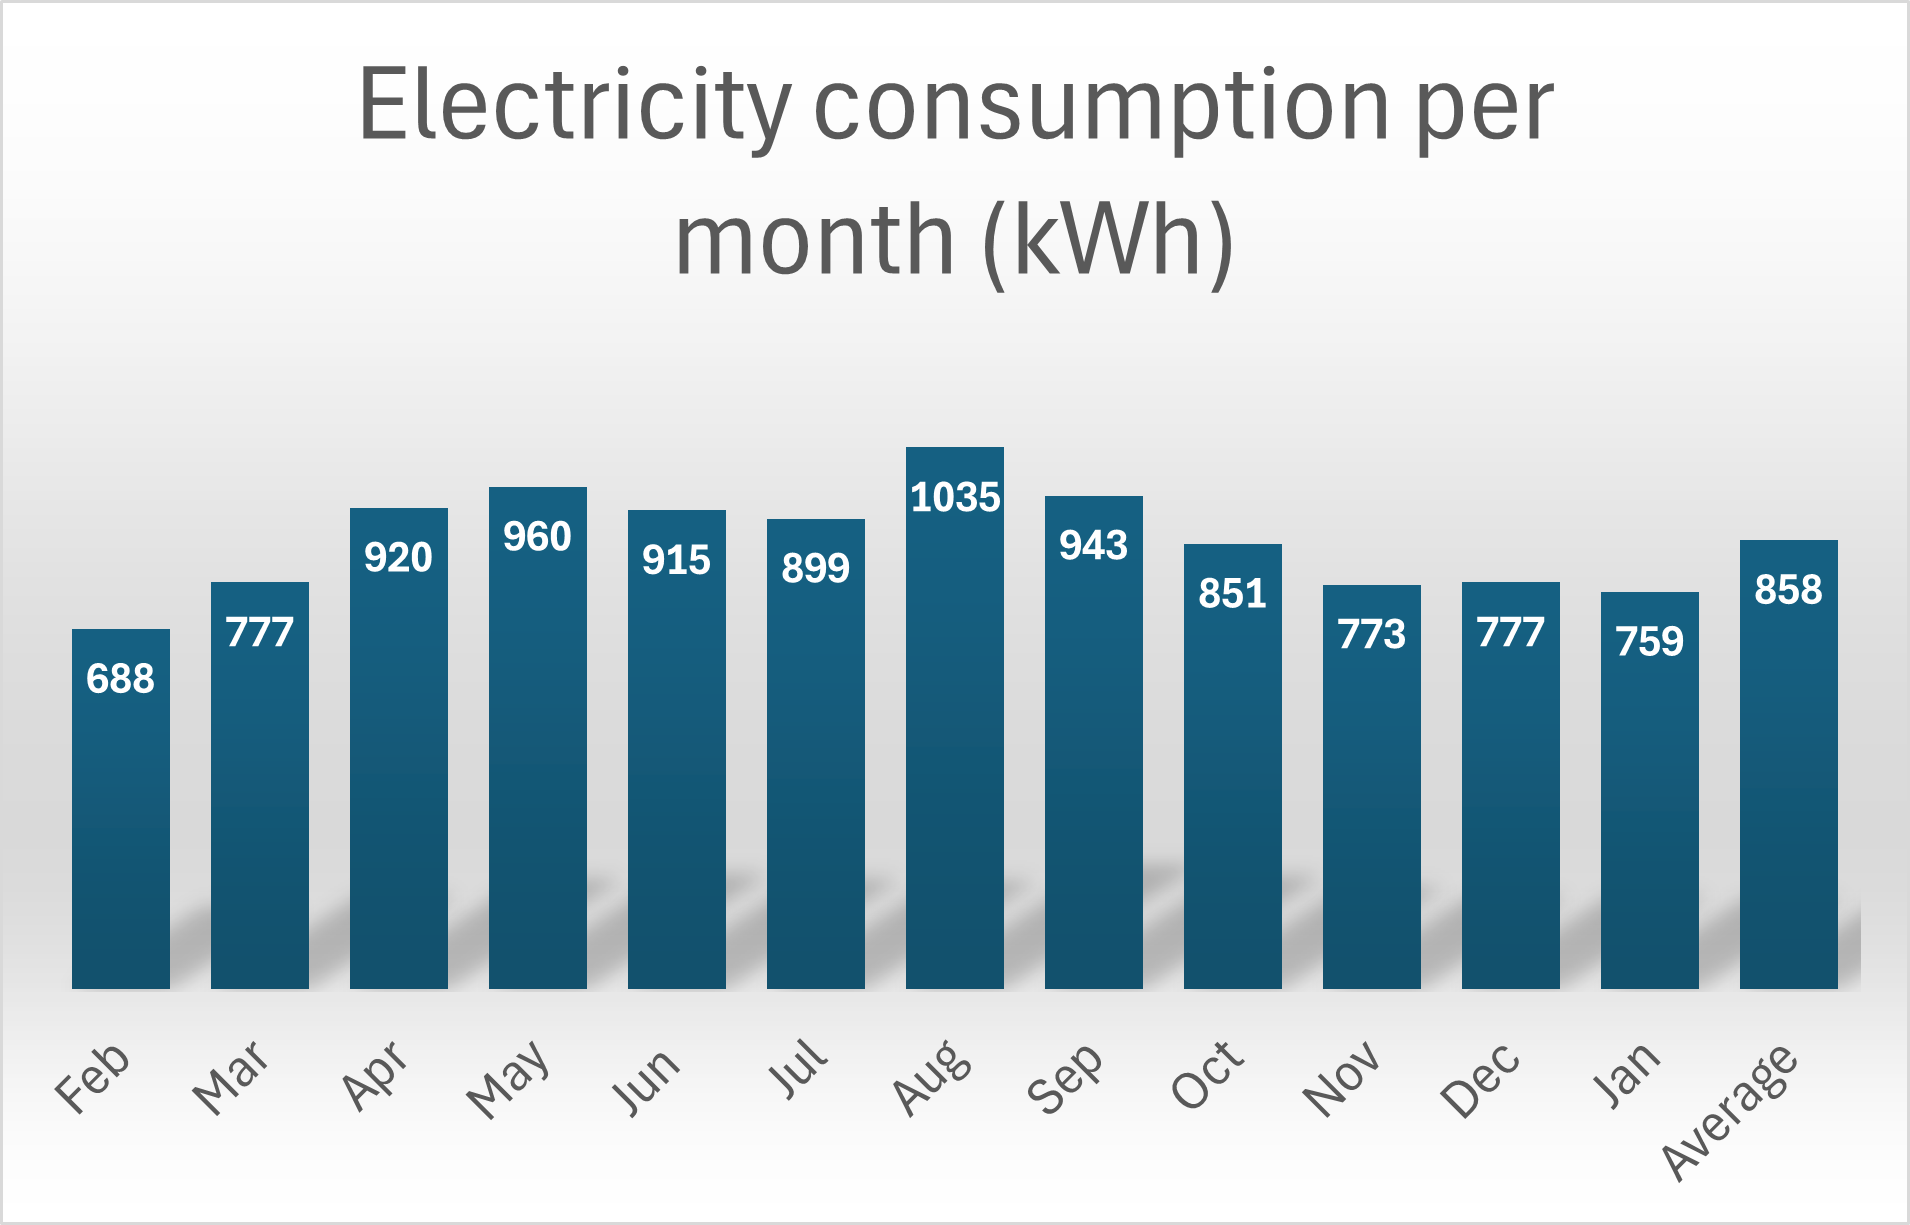
Electricity use per month (February 2025 to January 2026)
My estimations when weighing up the pros and cons of getting solar panels, included using a power consumption average of 875 kWh per month. This year we averaged 858kWh which is pretty much the same as last year and slightly less than estimated prior to getting solar panels and running the calculations. Good to see our power use has remained consistent and is not drifting higher.
Of the 858 kWh per month electricity use, 466 kWh has come from the grid and 392 kWh from solar production. That equates to an average of 54% from the grid. This is a pleasing drop of 8% from the 62% grid used electricity the previous year. The from the grid number got as high as 73% in June and and as low as 38% in December.
How much has our power bill been with solar panels?
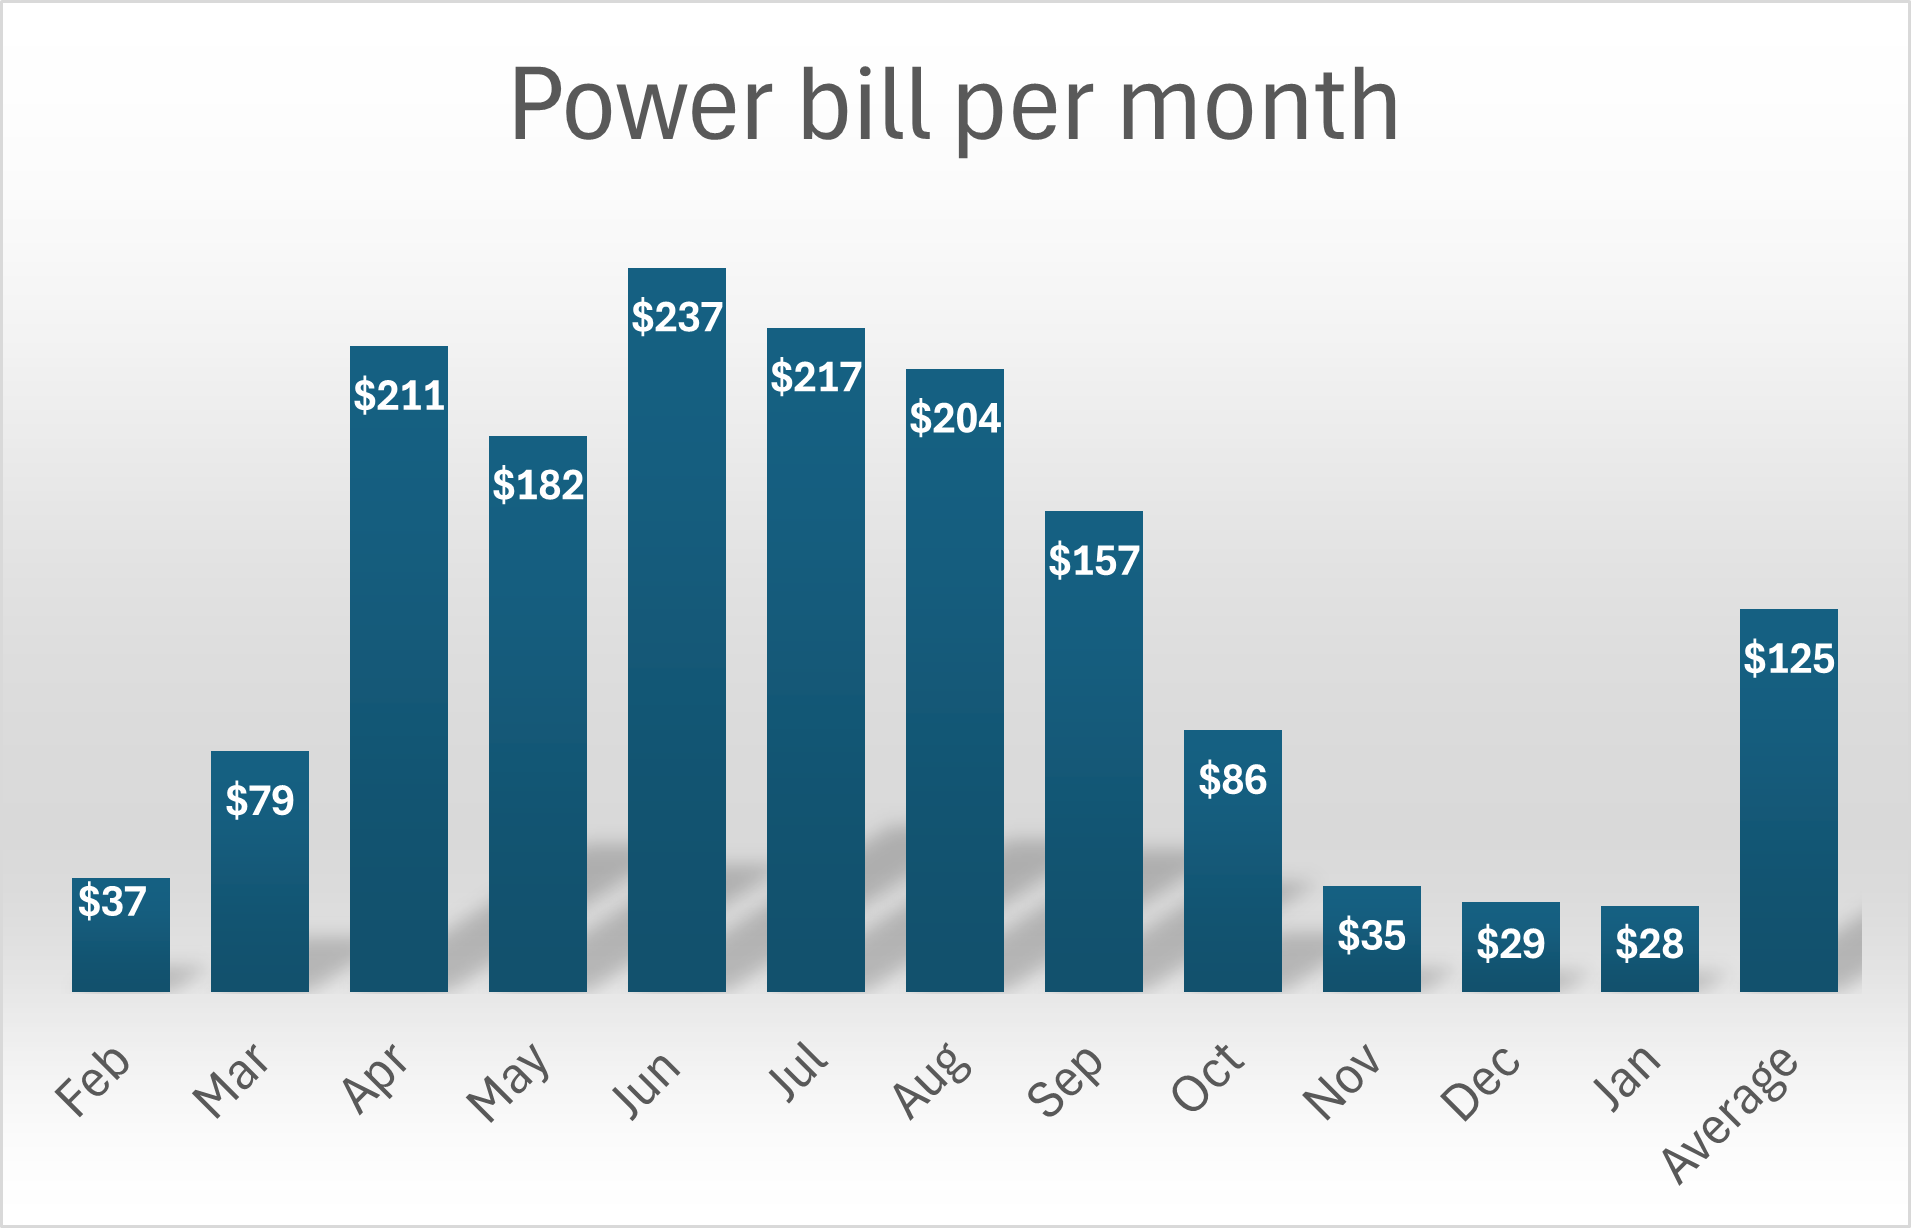
Power bill with solar panels (February 2025 to January 2026)
An average of $125 a month for a family of four (2 adults, 7 and 5 year old). A drop of $15 a month from the previous year which is great. A direct result of using more solar ourselves and less from the grid. Total power use was the same so the difference isn’t from less power consumption. Just more efficient use.
May look pretty normal to many (in particular the winter months). We are a very power hungry household though. We have a lot of electrical appliances for work and security and home automation. We also work from home. Plus we have two young kids that go through washing like it is out of fashion. Around 15 loads a week. All that is to say the actual power bill is not the important part here. What is more important is how much we would have paid if we didn’t have solar panels. The savings.
How much have solar panels saved us in the last year?
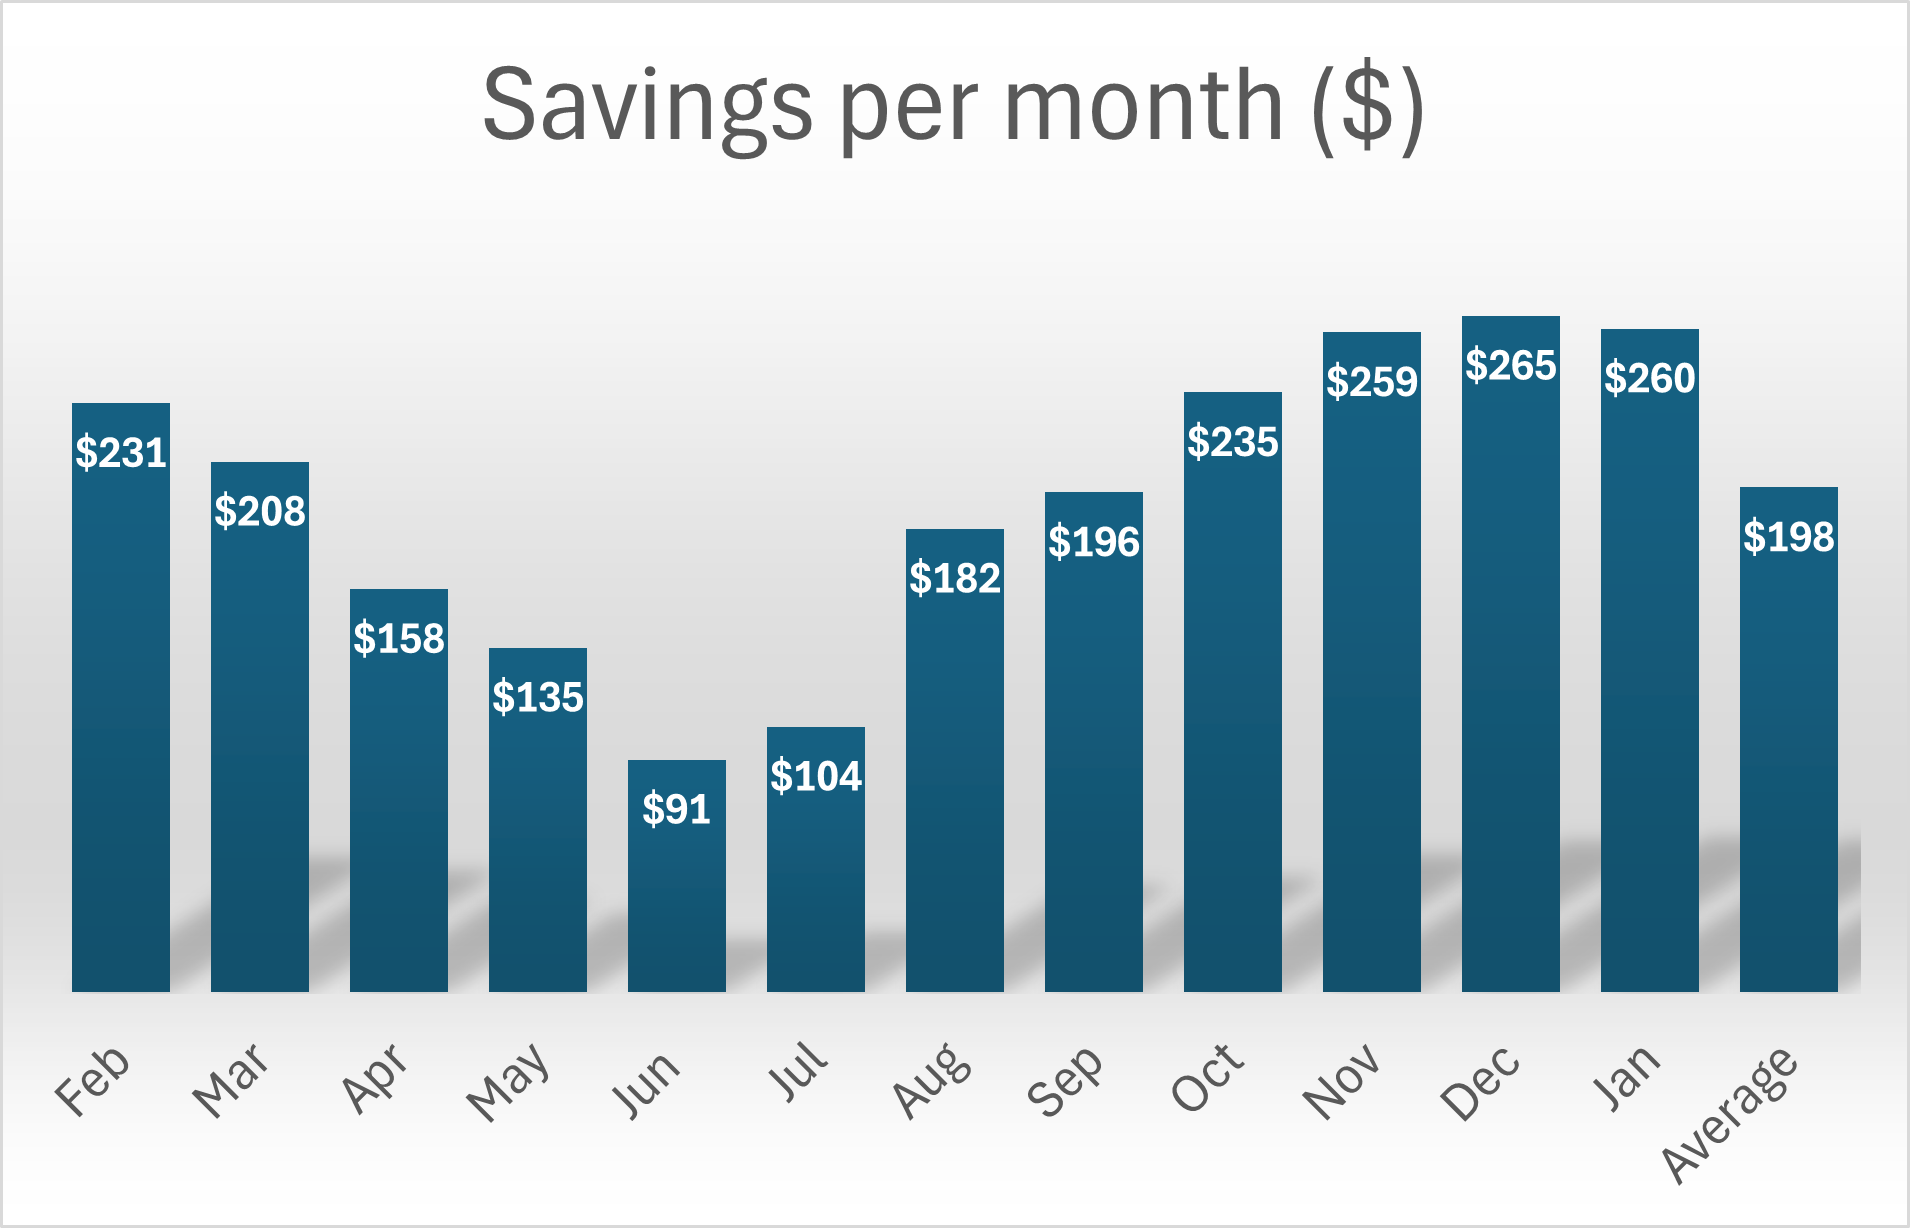
Monthly savings ($) from solar panels (February 2025 to January 2026)
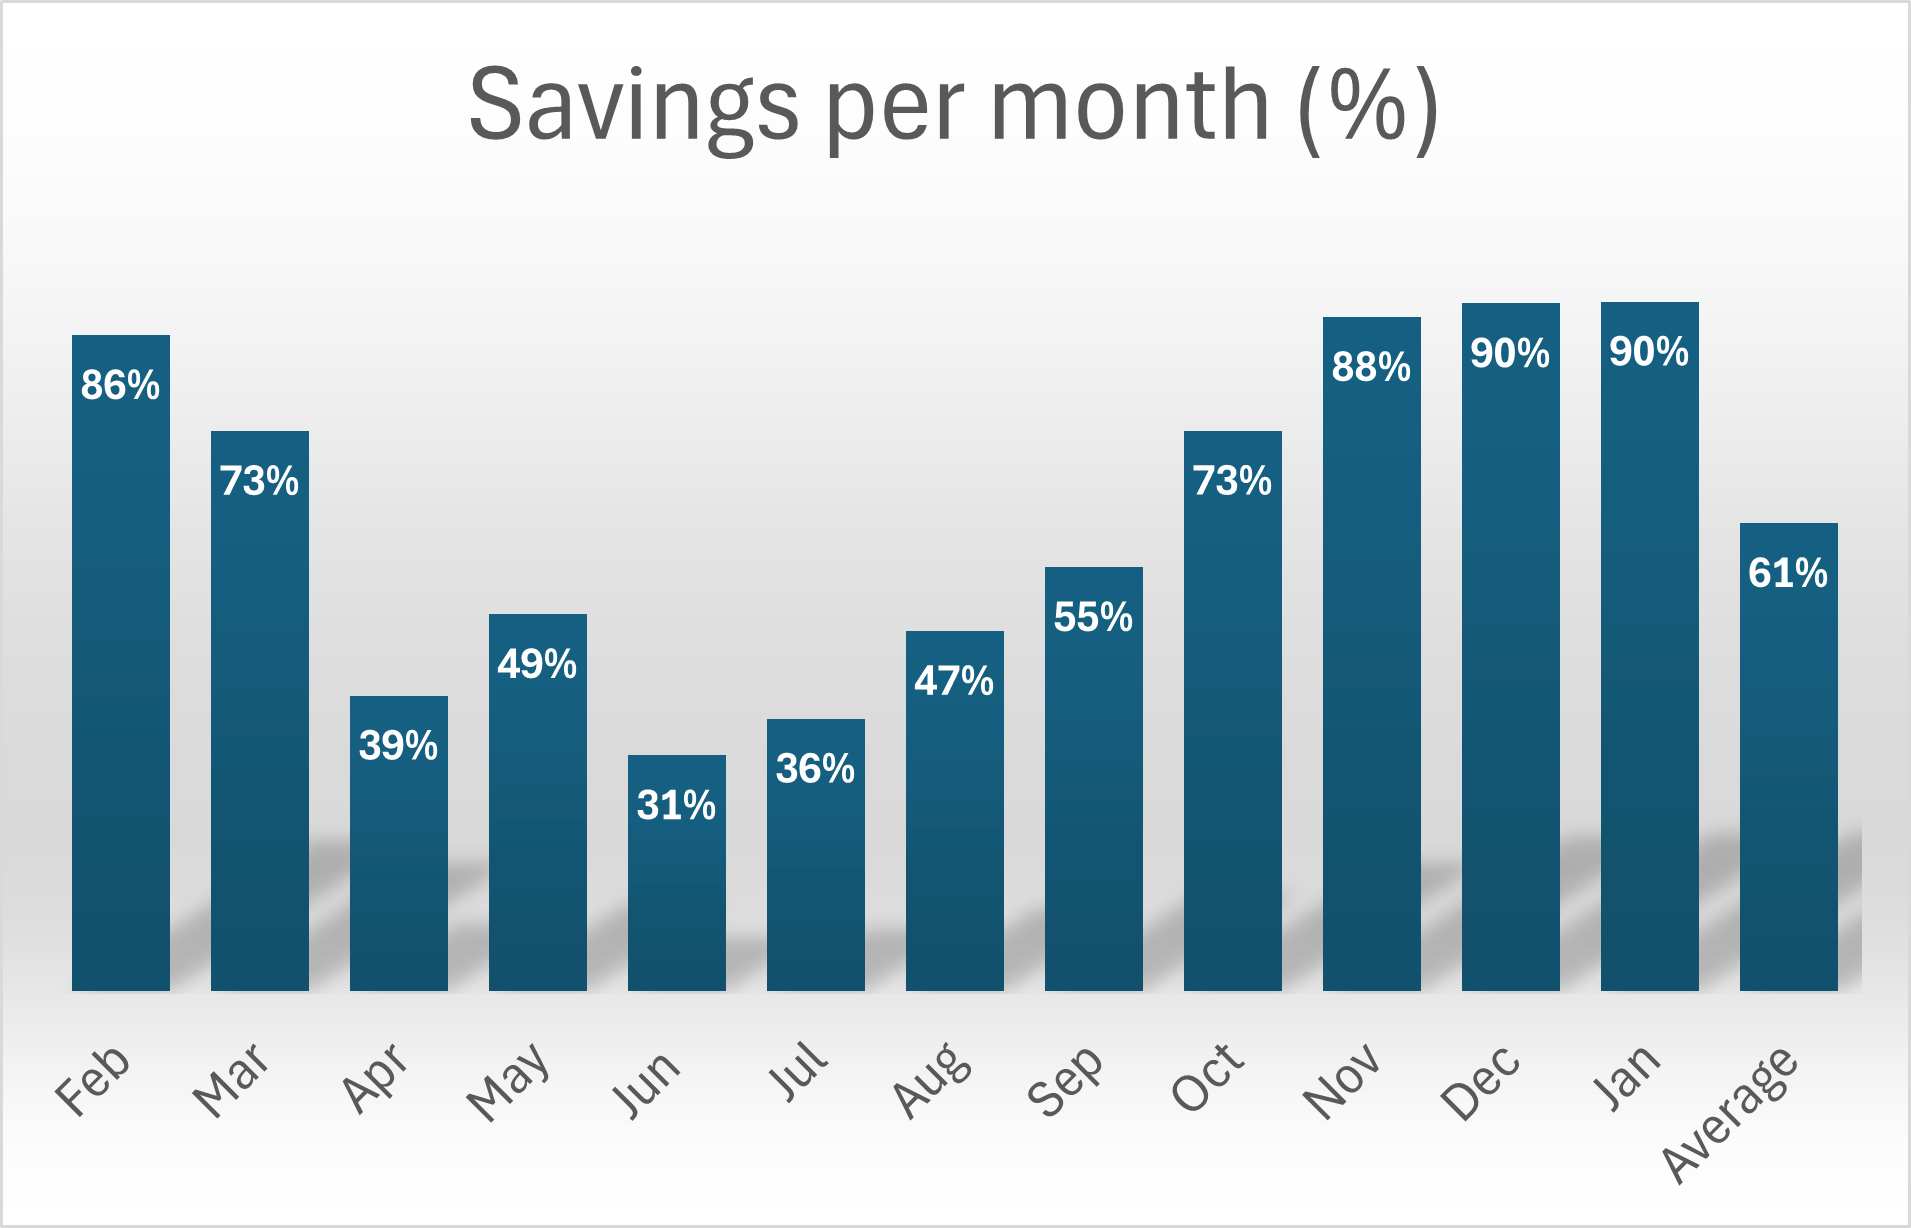
Monthly savings (%) from solar panels (February 2025 to January 2026)
Total annual savings of $2,375 had we not had solar panels. An average of $198 saved per month. An increase in annual savings of $180 from the previous year.
61% less than we could have been paying with no solar panels from February 2025 to January 2026. We had just 57% savings the previous year.
I’m pleased to see us increase from 57% savings from the first year of solar panels. I would think it is a result of smarter power use. Not less power use, but more efficient. We did also produce more solar by around 18kWh per month too which definitely helps.
When running the analysis on the decision to buy solar panels I was hoping for around $1,900 a year savings. At almost $2,400 for the second year I am happy with that. The first year was almost $2,200. We are above predictions and have saved $4,570 in the first two years.
Power prices will only go up from here. That will increase our savings over time. Right now, the cost of electricity is the lowest it will ever be. This will speed up the payback period even more so.
We have already recovered 24% of the cost of the $19,000 solar panels in two years. This was 11.5% at year one.
We are well on target for an 8-10 year payback period. More than likely it will be closer to 8 years than 10. As power prices increase, the cost of savings will only increase year on year.
Thanks for reading, and don’t forget we do have a solar panel payoff calculator on our website here if it is something you were interested in.