

In the last article we discussed the results of New Zealand based research of the 4% safe withdrawal rate study. In it we highlighted how big an impact a share market crash can have on whether or not we run out of money in retirement.
I won’t be leaving this to chance. The first ten years of retirement tend to be the most important indicator of whether our portfolio will last. If the market experiences large drops in the early years, then our chances of outliving our portfolio increase greatly. To reduce this sequence of returns risk I will personally be using a increasing equity glidepath strategy.
What is an equity glidepath?
Basically, it is the projected path of your equity allocations as you age. It can be increasing, decreasing, or static.
An increasing equity glidepath starts with a percentage of your portfolio in stocks and increases as we age. For example, at age 60 you may have 40% of your investments in stocks and 60% in bonds. The stock allocation may then increase by 2% (or any other number that suits) per year so that at age 90 you will have 100% in stocks. The starting point and incremental increases can be any number that suits your needs best. You can also cap the maximum exposure so it doesn't go all the way to 100%.
A declining glidepath is the most common approach and the opposite of the increasing glidepath. The equity portion of the portfolio decreases as we age. A common rule of thumb (that I don’t agree with) is 100-age. At age 60 this would mean 40% of our portfolio in stocks. At age 80 we would have 20% in stocks. A decrease of stock allocation by 1% per year.
A static equity glidepath is where we decide on our asset allocation and maintain it over the years. For example, 50% stocks and 50% bonds. If the stocks experienced a drop in value below 50% of our portfolio, then we would sell our bonds to rebalance the portfolio back to 50/50 allocation.
So why am I following the increasing glidepath example?
I used to accept the conventional wisdom that the declining equity glidepath is best. At a fundamental level it makes sense. The older we get the less risk we should probably take. But once I dug deeper I realised that it may not be the best option.
I did my own research using statistics from each 30-year period between 1976 and 1987. I looked at various portfolio allocations with different starting allocations, under all 3 types of glidepaths to see which portfolios had the best chance of success with a starting value of $600,000. In the examples I have rebalanced the portfolio to achieve the target glidepath allocation rate and assumed inflation of 2.5%. Bond returns were calculated on a 3% average and retirement spending started at $25,000 increasing each year with inflation. This is a withdrawal rate of approximately 4.2%.
Below are some tables showing the results of the NZ data.
Increasing equity glidepath data
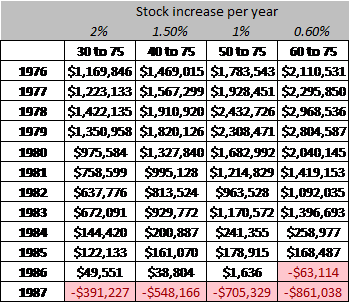
Increasing equity glidepath results
How to read the results: Starting with a $600,000 portfolio in 1976 of 30% equities, increasing to 75% equities at 2% per annum, we would have ended up with $1.17 million in 1976. Negative $391,000 if starting the 30-year drawdown period in 1987. You will see that the 30 to 75% equity glidepath has the lowest maximum, but it also has the lowest minimum. The higher our equity portion starts off the better our returns in MOST scenarios. HOWEVER, the scenarios where the higher equity starting point doesn’t succeed in are by far the worst performing. In this example, starting out withdrawals in 1986 and 1987 at the time of the big share market crash. The question becomes would we rather experience the chance for higher gains or the chance for lower losses?
Decreasing equity glidepath data

Decreasing equity glidepath results
Starting at 50% stock allocation, decreasing at a rate of 1% stock allocations per year, had the least periods of failure. Just 1 period out of 12 and that was the year of the 1987 market crash. This option also had the lowest highs though. Starting at the highest equity weighting had both the highest highs and highest lows. Again begging the question, would we rather experience the chance for higher gains or the chance for lower losses?
Static equity glidepath data
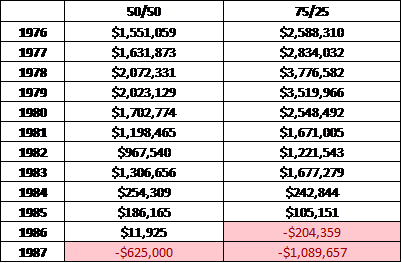
Static equity glidepath results
As expected, 50/50 portfolio had the lowest highs, but also the lowest lows. The 50/50 stock portfolio lasted the 30-year period for one extra period too. The 75/25 stock/bond portfolio didn’t last in the 30-year period starting 1986.
summary of results of equity glidepaths in new zealand
I have also ranked each of the 10 glidepaths from 1 (best) to 10 (worst) against different performance measures that can be seen in the tables below. Note: SWR = Safe withdrawal rate, which means the percentage of your investment portfolio at which you could safely withdraw each year and still have your money last.

Range of equity glidepath scenarios success rates

Range of equity glidepath scenarios best and worst results

Range of equity glidepath scenarios median results

Range of equity glidepath scenarios average successful safe withdrawal rates

Range of equity glidepath scenarios best and worst safe withdrawal rates
Final Thoughts
It is quite clear from the data that the portfolios that start with higher stock allocations have the highest end balance MOST of the time. The times they don’t, they tend to have the worst performance.
With any data we shouldn’t just look at the best scenarios. It is imperative to look at the worst cases too. When an economic recession occurs shortly after we retire that is when the opposite allocations work best. Starting with a low stock allocation and then increasing our allocation as the years progress.
The downside to the research is that it is only for 30-year periods. Just because a portfolio may be successful for a 30-year period, doesn’t mean it would have been OK over 31 years or more. This is a problem, especially for early retirees. This is why I have added a table (second to last) for where the end balance at 30 years was more than the starting balance. This is a good indication of a portfolio that will continue to last into perpetuity. All ten glidepaths had a 67% chance of having a 30-year balance higher than the starting balance.
What this tells me is that an increasing equity glidepath has just as much chance of increasing in value as all the other glidepaths. The increasing equity glidepaths starting at 30% and 40% stock allocations also had the best chance of not running out of money. The increasing equity glidepaths starting at 50% and 60% didn’t perform as well.
Sure, the traditional decreasing equity glidepaths performed better in most instances. The problem is how they performed during poor economic environments at the beginning of retirement. In short, the increasing equity glidepath worked well in both good and bad periods, whereas the decreasing equity glidepath performed excellent in good periods only.
I for one, want to be covered for the bad periods and am willing to take less of a win from the good periods as a sacrifice to experience more of a win in case of a bad period to start my retirement. For me, this is a partial hedge against sequence of returns risk. I would rather sleep at night than have a chance of having more than I need. Either a 30% or 40% increasing equity glidepath would be my personal pick at the moment, especially with stock market levels at such high valuations currently.
We all have different risk levels and ideas about our retirement withdrawals. Different strategies will be better suited to different people depending on personal circumstances and philosophies.
This study was only conducted over 12 x 30 year periods so it is by no means conclusive. It is enough though to show the devastating impact that a economic recession can have early on in our retirement. I’ll ask the question again. Would you rather experience the chance for higher gains or the chance for lower losses?
If you need help with your personal retirement planning, then get in touch today.
The information contained on this site is the opinion of the individual author(s) based on their personal opinions, observation, research, and years of experience. The information offered by this website is general education only and is not meant to be taken as individualised financial advice, legal advice, tax advice, or any other kind of advice. You can read more of my disclaimer here